



Your youth pastor runs an after-school program. Your deacon coordinates food distribution. Someone else handles hospital visits. Each ministry counts success differently — attendance sheets here, meal counts there, prayer requests somewhere else. By the time you're compiling quarterly reports, you're comparing apples to oranges to bread loaves.
Churches with limited staff face a specific challenge when it comes to measuring outreach program impact. Not because tracking is conceptually hard, but because every additional data point creates work for people already stretched thin. The result? Either you track nothing meaningful, or you build an elaborate system that collapses within a few months when the volunteer coordinator burns out.
The failure isn't lack of desire to measure impact — it's treating measurement like an academic exercise instead of an operational one.
Why churches default to vanity metrics (or no metrics)
Small churches typically fall into one of three measurement traps.
The first is the attendance-only trap. Count heads at events, report the number, call it done. Except attendance tells you nothing about actual impact. Twenty people showing up to your food pantry could mean twenty families fed once, or five families coming four times because they're in crisis. Without context, the number is operationally useless.
The second is the everything-is-data trap. Some churches — usually after hiring their first operations person — try tracking everything. Volunteer hours, donation sources, program costs, participant demographics, follow-up rates. Within weeks, data entry becomes a second job and staff start resenting the tracking more than valuing the insights.
The third is the narrative-only trap. "We're making a difference in the community" sounds fine in board meetings but gives you zero operational guidance. You can't allocate resources, adjust programs, or demonstrate impact to donors with feel-good stories alone.
The operational sweet spot sits somewhere between these — enough data to guide decisions without creating administrative burden.
Pick three metrics that actually drive decisions
Effective measurement starts with prioritization. Not everything worth knowing is worth tracking. For churches running multiple outreach programs with minimal staff, three core metrics usually capture most of what matters operationally.
Simplify your church’s day-to-day operations.
Parshly helps you organize events, track donations, and engage your congregation—all in one place.
- Centralized member management
- Donation tracking & reporting
- Volunteer scheduling & notifications
No credit card required
Metric 1: Unique households served (not individual touches)
Track families, not interactions. A household attending your food pantry monthly represents different operational needs than four households coming once. This shift from counting events to counting relationships fundamentally changes how you understand outreach program impact in a church setting.
One church discovered their "200 monthly food pantry visits" actually represented 47 households — with 12 families accounting for roughly 60% of visits. That single insight completely shifted their resource planning from bulk purchasing to family-specific support packages.
Metric 2: Program cost per outcome
Define one clear outcome per program, then track cost against it. Food pantry? Cost per family fed monthly. After-school program? Cost per child completing the semester. Hospital visitation? Cost per family receiving sustained support.
This isn't about cutting costs — it's about understanding resource efficiency. When your tutoring program costs $300 per child per semester but your sports league costs $95, you make different volunteer recruitment decisions.
Metric 3: Volunteer capacity utilization
Track the percentage of volunteer shifts filled versus needed, not total volunteer hours. If your food pantry needs 8 volunteers but averages 5, that 62% utilization rate tells you more than "40 volunteer hours monthly."
Churches often discover certain programs run at 40% volunteer capacity while others have waiting lists. Without systematic tracking, that mismatch stays invisible.
Build a tagging system that works without a database manager
Tags beat complex categorization every time for resource-constrained churches. Instead of building elaborate hierarchies, use simple, overlapping tags that any volunteer can apply consistently.
Start with three tag categories:
Program tags (one per interaction):
-
FOOD
-
YOUTH
-
SENIOR
-
BENEVOLENCE
-
EDUCATION
Frequency tags (for households):
-
WEEKLY
-
MONTHLY
-
OCCASIONAL
-
FIRST-TIME
-
CRISIS
Referral tags (track source):
-
MEMBER
-
WALK-IN
-
PARTNER-ORG
-
COUNTY
-
SELF
A family might be tagged: FOOD + MONTHLY + COUNTY. Another: YOUTH + WEEKLY + MEMBER. Simple enough that volunteers apply them correctly, rich enough to reveal patterns.
The value shows up in combinations. FOOD + CRISIS + COUNTY might indicate families referred by social services during emergencies — which could point toward partnership opportunities. YOUTH + FIRST-TIME + WALK-IN might tell you the neighborhood actually knows your programs exist.
Print a one-page cheat sheet of common tag combinations for volunteers to reference while tagging.
The value shows up in combinations. FOOD + CRISIS + COUNTY might indicate families referred by social services during emergencies — which could point toward partnership opportunities. YOUTH + FIRST-TIME + WALK-IN might tell you the neighborhood actually knows your programs exist.
Create one dashboard everyone actually uses
Multiple dashboards guarantee nobody looks at any of them. Build one simple view that answers the questions people actually ask during operations.
Your single-page dashboard needs four sections:
-
This Week's Operations (top-left)
- Programs running - Volunteer gaps - Resource needs
-
Monthly Trend (top-right)
- Households served (trend line) - Cost per outcome (trend line) - Volunteer utilization (percentage)
-
Quarter Comparison (bottom-left)
- Current quarter vs. last quarter - Current quarter vs. same quarter last year - Simple up/down arrows
-
Red Flags (bottom-right)
- Any metric 20% below average - Volunteer utilization below 50% - Cost per outcome up 30%+
Put this dashboard somewhere visible and update it weekly, even when some numbers don't change. Consistency matters more than perfection here.
One church printed their dashboard weekly and posted it on a bulletin board when they couldn't afford a display screen. Staff started discussing the numbers during coffee breaks without anyone asking them to — organic adoption beats forced compliance every time.
Design surveys that people complete in 90 seconds
Long surveys guarantee low response rates. Churches need feedback, but asking twenty questions about spiritual growth after someone picks up groceries feels tone-deaf and operationally pointless.
Build three survey templates, each under five questions:
First-time participant survey:
-
How did you hear about this program?
-
Did you find what you needed today?
-
What other support would help your family?
(Skip ratings, focus on information)
Regular participant check-in:
-
Has this program helped your situation improve?
-
What's your biggest challenge right now?
-
Would you recommend this to others?
(Track trajectory, not satisfaction)
Volunteer experience survey:
-
Did you have what you needed to help today?
-
What would make serving easier?
-
Can you serve again next month?
(Focus on retention, not happiness)
Hand these out on index cards, not tablets. Include a box for anonymous returns. You'll get somewhere around 60-70% completion versus 15% for digital surveys in this context.
Monthly check-ins that don't feel like performance reviews
Traditional monthly reviews focus on what happened. Operational check-ins focus on what needs to change. That distinction matters when staff time is genuinely limited.
Structure monthly check-ins around three questions:
"What surprised us?" Look at your dashboard and identify unexpected patterns. Maybe Tuesday food pantry sessions serve twice as many families as Thursday. Maybe youth program attendance drops during basketball season. Surprises reveal operational improvements.
"What's about to break?" Every program has a breaking point — volunteer coordinator burnout, storage space, funding gaps. Identifying these before crisis hits lets you adjust proactively instead of reactively.
"What small change could we test?" Not overhauls — tweaks. Moving food distribution 30 minutes earlier. Adding a Spanish-speaking volunteer. Texting reminders to occasional participants. Small tests risk little but sometimes unlock real improvements.
Keep these check-ins under 30 minutes. Document decisions in one paragraph, not lengthy meeting minutes. The goal is operational adjustment, not bureaucratic compliance.
The two-quarter implementation timeline
Measurement systems fail when churches try implementing everything at once. A staged approach builds momentum without overwhelming staff.
Quarter One: Foundation
| Week | Focus |
|---|---|
| 1–2 | Choose your three metrics |
| 3–4 | Design your single dashboard |
| 5–8 | Start manual tracking (spreadsheet is fine) |
| 9–12 | Refine based on what's actually getting tracked |
Here's a simple workflow visualization of the two-quarter rollout.
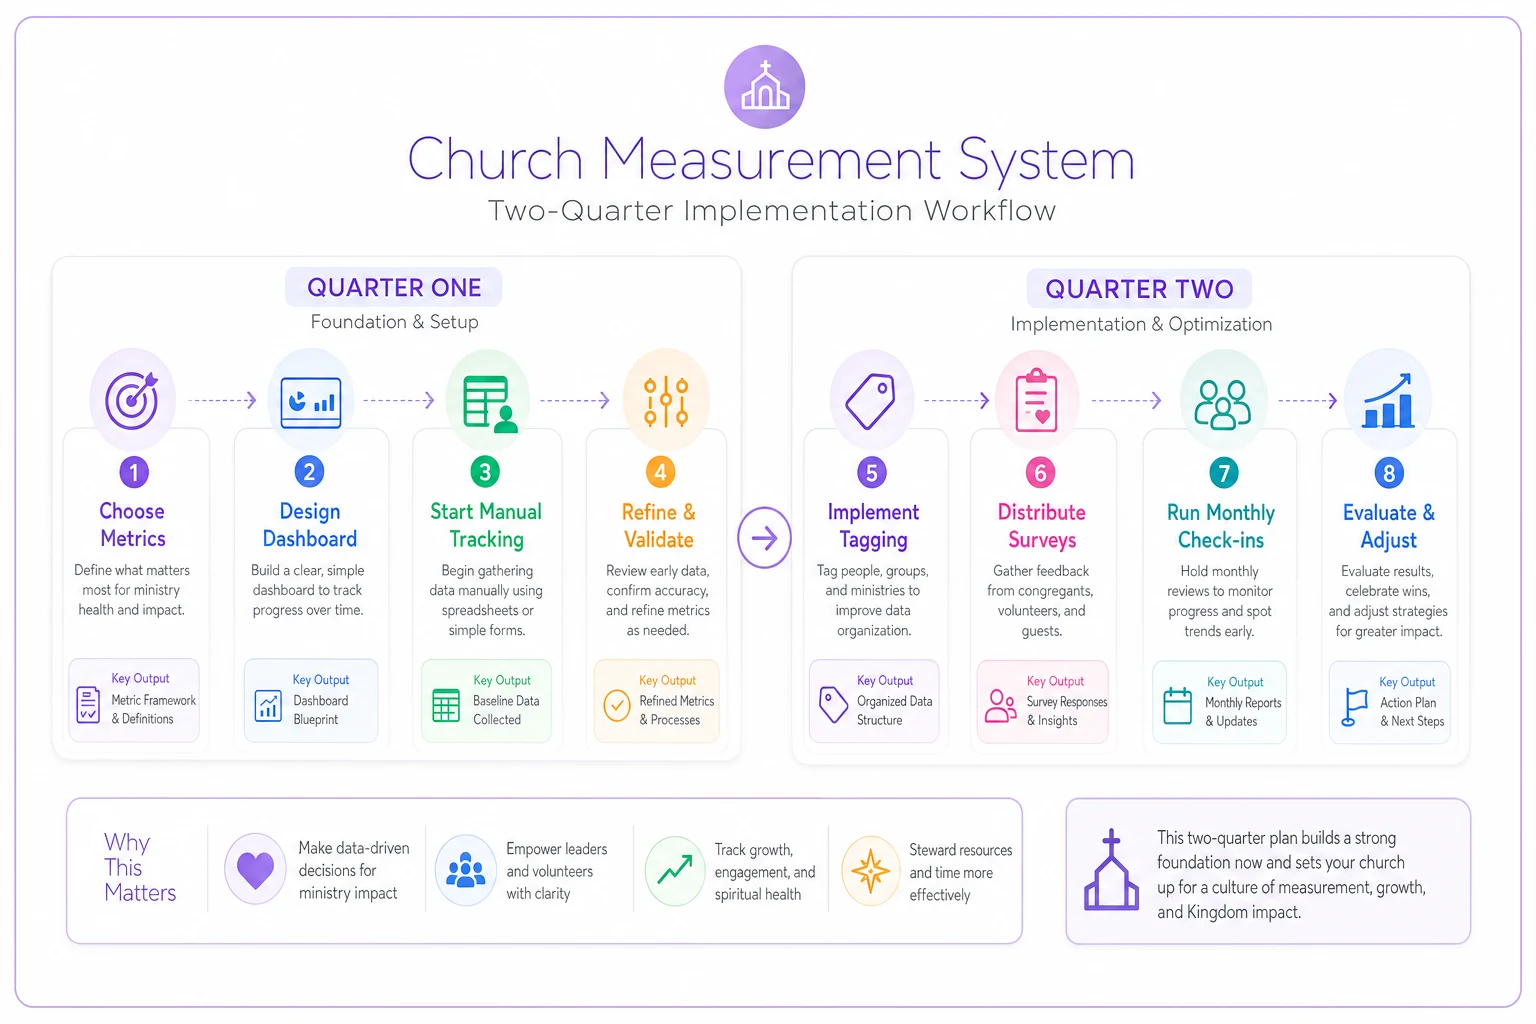
Quarter Two: Enhancement
| Week | Focus |
|---|---|
| 1–2 | Implement tagging system |
| 3–4 | Distribute first surveys |
| 5–8 | Run monthly check-ins |
| 9–12 | Evaluate and adjust |
Churches that follow something like this usually start seeing clear patterns around month four. One rural church discovered their senior meal program served 31 households regularly, but their grant reporting claimed 100+ seniors served. Adjusting their grant narrative to focus on depth of consistent support rather than broad reach actually strengthened their renewal application.
Common measurement mistakes that sabotage impact tracking
Mistake 1: Measuring activities instead of outcomes
"We distributed 500 pounds of food" sounds impressive but means nothing operationally. Did it feed 50 families once or 10 families for a month? Track outcomes — families fed — not activities like pounds distributed.
Mistake 2: Creating metrics you can't influence
Tracking "community poverty rate" might feel meaningful, but your food pantry can't directly change it. Focus on metrics your operations actually control.
Mistake 3: Comparing incomparable programs
Your youth sports league and senior visitation ministry serve different purposes. Don't force unified metrics across dissimilar programs. Let each program define its own primary outcome.
Mistake 4: Pursuing precision over consistency
Better to track approximately right than precisely wrong. If you consistently estimate 45-50 households served rather than exact counts that vary wildly depending on who remembers to track, your trends stay useful.
When automated tracking starts making sense
Manual tracking works fine for churches serving under 100 households monthly. Beyond that, the administrative burden starts outweighing the value. That's when operational software becomes less of a luxury and more of a necessity.
Modern church management platforms handle the tedious parts — automatic tagging based on program participation, household deduplication, volunteer hour aggregation. The AI-assisted components are particularly useful for pattern recognition across programs. Instead of manually noticing that families using the food pantry often need youth programs, the system surfaces those connections on its own.
The breaking point usually comes when staff are spending more time compiling reports than running programs. One church found their operations coordinator was burning around 12 hours a month just creating board reports — time that could have supported another entire outreach program.
These platforms also solve the consistency problem. When volunteers rotate out, your tracking doesn't collapse with them. When the person who built your spreadsheet goes on vacation, data collection continues. That operational continuity alone often justifies the cost.
Moving beyond guessing to knowing
Most churches want to measure their outreach program impact. The breakdown happens in the gap between intention and implementation — between what seems ideal and what's operationally realistic.
This system isn't perfect. It won't capture every dimension of spiritual transformation or community change. But it will tell you whether your food pantry serves 30 or 300 families, whether your youth program costs $50 or $500 per participant, whether your volunteers are overwhelmed or underutilized.
Start with three metrics. Build one dashboard. Create short surveys. Run quick monthly check-ins. Consistency beats complexity.
Within six months, you'll understand your operational reality well enough to make informed decisions about resource allocation, program expansion, and impact reporting. The churches that successfully measure impact aren't the ones with perfect systems — they're the ones with sustainable systems that match their operational reality. Build for the staff you have, not the staff you wish you had. Track what drives decisions, not what sounds impressive in a report.
Your congregation trusts you to steward resources wisely. That stewardship requires knowing what works, what doesn't, and what might work better. Stop guessing and start measuring — but measure only what matters, and keep it simple enough that it actually happens.
Your congregation trusts you to steward resources wisely. That stewardship requires knowing what works, what doesn't, and what might work better. Stop guessing and start measuring — but measure only what matters, and keep it simple enough that it actually happens.
Ready to transform your church management?
Join 500+ churches using Parshly to enhance community engagement, streamline administration, and grow their ministries.